
The market has taken a downturn, and every other blog or tweetstorm seems to offer the same general advice: conserve cash, extend runway, shift from focusing on growth to focusing on efficiency. We’ve advised many of our later stage growth companies through market ups and downs, and we’ve realized that, when the market dips, founders crave advice that goes beyond the platitudes and provides a tangible framework to quantify the magnitude of the change in valuations and what it means for their next round and charting their future course.
In this post, we go through the diagnostic framework that we use when we sit down with founders: reevaluate your valuation, understand your burn multiples, and build scenario plans.
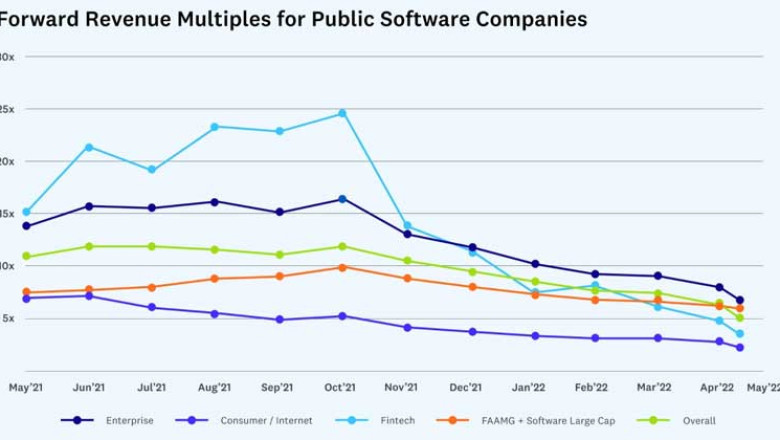
We start with quantifying how valuation multiples have changed (your valuation multiple is the ratio of your valuation to revenue). Here, public markets provide the best basis for recalibrating private growth valuations because public markets tend to see the effects of decreased valuations first. For instance, in the current market (as the graph below shows), median public company software valuations have dropped from 12x forward revenue to 5x or less since highs in October 2021, representing an almost 60% decline. The same goes for fintech and consumer internet companies, which are also down over 70-80%.
However, the impact on venture markets will not be clear until data for the coming months and quarters filters in, and even then, many deals announced in Q2 were likely priced in Q1. In other words, it can take 6+ months before we see what impact the public market downturn has had on venture funding.
Downturns hit different sectors differently, making it important to look at relevant public companies to best gauge where you stand. For instance, a year ago, it was common to see funding valuations for late stage private companies that were 100x of ARR (equivalent to run rate revenue). If you did your last round at $20M ARR, growing 3x, you may have raised at a $2B valuation.
But things look very different now. You can get a rough estimate for the change in your valuation by looking at leading public companies in your sector. If they’re down 60%, there’s a good chance you’re in a similar position. When looking at high growth public software companies, you’ll want to compare your ARR valuation multiple to their revenue valuation multiples because of its availability as a GAAP accounting metric.
Once you have an idea of how much your market segment has dipped, how do you recalibrate your goals for this new lower valuation environment?
A helpful exercise is to figure out what ARR you need to reach to get back to your last round’s valuation and plan accordingly. To do this, use the estimated change in valuation multiples from leading public companies in your space and add a growth- and efficiency-adjusted premium for your faster growth. Then use this number to calculate the ARR you need to get to. Your goal should be to hit this revenue target with at least 12 months of runway. If you can do this, you’ll be in a strong position to raise your next round of funding. Raising capital with less than 12 months of runway sends a negative signal to the market and makes it harder to have a good fundraise.
Continuing our example, a $20M ARR business which last raised at $2B might observe the leading public companies in its space trading at 10x revenue, rather than 100x. Adjusting for the startup’s faster pace of growth, relative to public comps, let’s say that 15x ARR is a reasonable valuation for its next round of funding. (Note: 15x ARR represents a 50% premium to the leading companies in their sector and a 200% premium to the software average of 5x, but the appropriate multiple will vary across companies.) This means their goal should be to reach $133M of ARR, or $2 billion divided by 15x, with 12 months of runway.
Now that you have a target ARR, how do you evaluate if your business is growing efficiently to reach it? Here we shift our focus to burn multiples, which we define as cash burned divided by net ARR added. For example, if a company burns $40M to add $10M of ARR, it would have a burn multiple of $40M/$10M, or 4.0x. Burn multiples are a metric you can evaluate every quarter, and tracking it closely can ensure you stay on plan.
We like burn multiples more than other efficiency metrics for recalibrating when market conditions change because they are all-encompassing of your business activities. Unlike other efficiency scores (e.g., LTV/CAC) that focus just on sales and marketing, actions you take across every business function will impact your burn multiple. Because it’s all encompassing, good looks different at different stages – a company at $5M of ARR will have far less operating leverage than a company with $100M of ARR. You should see a decrease over time with the objective of crossing zero as a company becomes cash flow positive.
We looked at the burn multiples of private companies at different stages of growth to arrive at some general guidelines for what good and not-so-good burn looks like as you scale.
These metrics are a helpful starting point for companies at different stages, but you should never look past the constraints of your business. If you need to add $100M of ARR with $50M of burn, you should build a plan to make sure your burn multiple is less than 0.5x. If your burn multiple isn’t where you need it to be, there are many ways to improve your burn multiple to grow more efficiently, including right sizing different functions, improving margins, or lowering CAC. In this piece, we’re going to stay focused on our diagnostic framework, but we’ve previously covered how to use your financials to navigate market turbulence.
Burn multiples and valuation multiples tell you how efficiently and how much you need to grow, respectively. However, when the fundraising environment changes and getting capital becomes more uncertain and more expensive, you also have to carefully watch your cash balance and manage your runway. Scenario planning is helpful for considering how macro events – wars, supply chain issues, inflation – could impact performance metrics, like growth and CAC. Keeping a close eye on cash outlay and having scenario plans will enable you to quickly adjust spending and investment in response to performance.
At a minimum, we recommend planning for the following three scenarios:
Once you have these plans, assess where you are on a quarterly or monthly cadence, and then adjust your spending and hiring accordingly. While we hope you are headed towards the best case scenario, if you find that you are heading towards the worst case scenario, there will likely be difficult decisions to make–do you need to layoff employees? Do you need to raise debt or a down round? There is no one-size-fits-all answer to these questions, and if you find yourself facing them, it’s time to turn to the advisors who know your business best and can help you chart a course to survive.
Through market uncertainty and downturns, it’s important to remember that markets are cyclical and downturns come with a silver lining. Some of the strongest businesses are forged in the toughest times, and often, those that survive when the market turns are rewarded with increased market share and leaner, more efficient operations.
Justin Kahl is a deal partner on the Growth investing team at a16z. Previously, he was at Bain Capital.
David George is a general partner at a16z where he invests in growth stage companies. Prior to joining the firm, he worked at General Atlantic, FFL Partners, and William Blair & Company.
Technology, innovation, and the future, as told by those building it.
Check your inbox for a welcome note.
Views expressed in “posts” (including articles, podcasts, videos, and social media) are those of the individuals quoted therein and are not necessarily the views of AH Capital Management, L.L.C. (“a16z”) or its respective affiliates. Certain information contained in here has been obtained from third-party sources, including from portfolio companies of funds managed by a16z. While taken from sources believed to be reliable, a16z has not independently verified such information and makes no representations about the enduring accuracy of the information or its appropriateness for a given situation.
This content is provided for informational purposes only, and should not be relied upon as legal, business, investment, or tax advice. You should consult your own advisers as to those matters. References to any securities or digital assets are for illustrative purposes only, and do not constitute an investment recommendation or offer to provide investment advisory services. Furthermore, this content is not directed at nor intended for use by any investors or prospective investors, and may not under any circumstances be relied upon when making a decision to invest in any fund managed by a16z. (An offering to invest in an a16z fund will be made only by the private placement memorandum, subscription agreement, and other relevant documentation of any such fund and should be read in their entirety.) Any investments or portfolio companies mentioned, referred to, or described are not representative of all investments in vehicles managed by a16z, and there can be no assurance that the investments will be profitable or that other investments made in the future will have similar characteristics or results. A list of investments made by funds managed by Andreessen Horowitz (excluding investments for which the issuer has not provided permission for a16z to disclose publicly as well as unannounced investments in publicly traded digital assets) is available at https://a16z.com/investments/.
Charts and graphs provided within are for informational purposes solely and should not be relied upon when making any investment decision. Past performance is not indicative of future results. The content speaks only as of the date indicated. Any projections, estimates, forecasts, targets, prospects, and/or opinions expressed in these materials are subject to change without notice and may differ or be contrary to opinions expressed by others. Please see https://a16z.com/disclosures for additional important information.


![Live Aid (Queen) Full Concert [1985, London, Wembley Stadium]](https://nexth.city/upload/media/posts/2022-07/29/live-aid-queen-full-concert-1985-london-wembley-stadium_1659093801-s.jpg)


Comments
0 comment